Grow Your Business with
Our Data Solutions
We help you make smart business decisions
by making the best use of your data.


Our Services
Common techstack: Tableau, Looker, PowerBI, Mode, Plotly, R Shiny
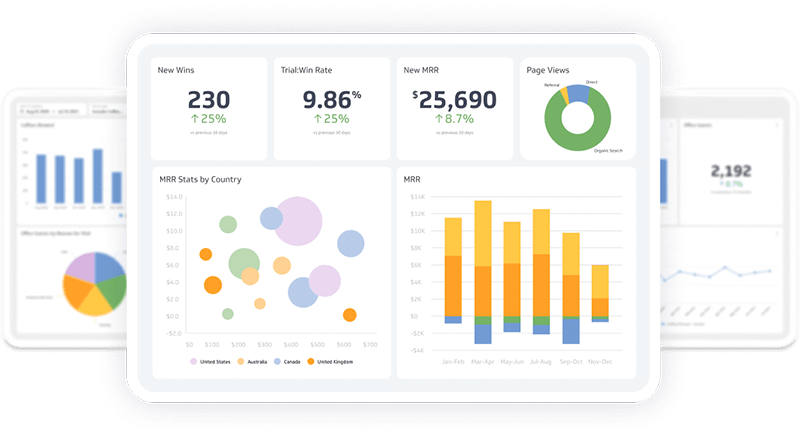
Dashboard & Report Development
Have a lot of KPIs you need to measure and track? Say no more! We create beautiful visualizations that neatly display key metrics and insights, enabling improved and fast data-driven business decisions.
Our dashboards are easily accessible and scheduled to update periodically, so you don't have to manually refresh each time you want to access the latest data.

Common techstack: Airflow, Snowflake, BigQuery, MongoDB, AWS, Azure
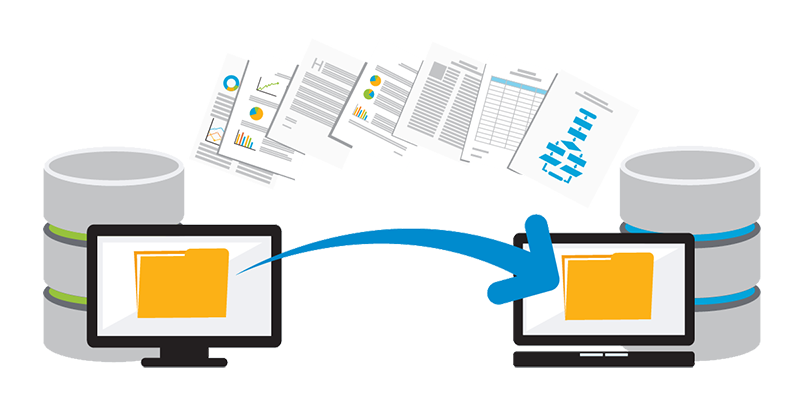
Data Warehousing & Management
Do you have a large amount of data? We got you covered. We create and maintain infrastructures required to support your Big Data. We set up pipelines and automation for data flows so you can focus on growing your business, not on data maintenance.

Common techstack: Python, Flask, Django
Data-Driven App Development
We build software applications that can interact with your data. Whether it's for an internal use or it's a customer-facing application, we will build scalable software solution that will fit your need.

Common techstack: R, Python, SQL, Tableau
Technical Data Training
We help clients move to a reproducible, code-based approach to research, analysis, and reporting. We provide hands-on training using popular data analytics technology stacks, such as R, Python, SQL, and Tableau. Understanding these tools, your staff will be able to perform data analyses, create visualizations, and publish reporting dashboards.
Case Studies
Technology used: SQL, Python, Slack, DigitalOcean
Anomaly Detection Program
We were tasked with building a anomaly detection system that periodically scanned databases to detect an anomaly. The goal was to quickly be alerted in case of a sudden drop in sales volume.
When the detection program found an anomaly (e.g. a sudden drop in sales volume), it sent an alert message via email and Slack. This ensured that the client was able to quickly identify and address any problem with the sales channel.
Technology used: AWS, Redshift, SQL, Tableau, R Shiny
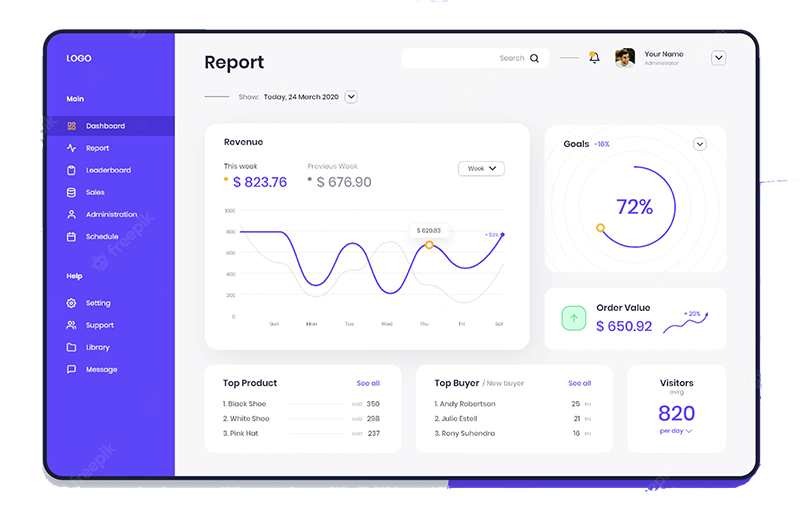
Interactive Sales Dashboard
The work was done to serve C-level executives of an international online company. The client wanted to get a clear understanding of the company's sales, profit margins, and refunds.
We aggregated raw transaction data to produce aggregated sales and returns data for dozens of products, grouped by different sales channels (multiple websites), languages (Spanish vs. English), sale methods (phone sale vs. web sale), and geographic regions.
From there, we were able to determine the best performing products, sales channels with the highest/lowest conversion rates, refund rates by sales channels, etc.

Technology used: SQL, R
Customer Churn Analysis
We had a client who was experiencing a very high refund/chargeback rate. The client wanted to reduce the customer disatisfaction by preemptively identifying and proactively reaching out to dissatisfied customers.
To do so, we gathered various data points around their customers: number of calls to the support center, duration of those calls, page in the funnel where their users were "stuck", etc. And for each for those customers who did not complete their process, they were scored 1 - 10, 1 being extremely dissatisfied and 10 being extremely satisfied.
Once these unhappy customers were identified (satisfaction score of below 4), the client preemptively reached out to their customers via phone or email in order to reduce the chance of them initiating refunds/chargebacks. In a span of few months, we reduced the refund/chargeback rate from 12% to under 7%.

Technology used: SQL, Python, SendGrid, AWS
Product Recommendation System & Email Campaign
Working with a retail company, we were asked to build a recommendation engine that would recommend products to its customers based on their geographic location and their previous purchase history.
We created a program that would produce a daily batch of product recommendations, which were auto-loaded to an email tool and distributed to customers.
Technology used: Python, DigitalOcean
Scheduled Data Migration
To train the models, we looked at various factors, such as the number of calls to support center, duration of those calls, number of visits to the website, and more.
Once these unhappy customers were identified, the goal was to preemptively reach out to them via phone or email in order to reduce the chance of them initiating refunds/chargebacks.